Come visit your data in Split Second
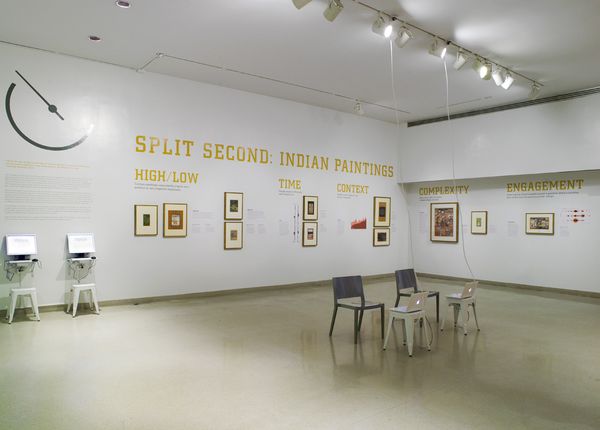
Watching Split Second: Indian Paintings get installed into the gallery this week has been a real thrill for me. I believe it is vital that digital projects inhabit the museum in real space, not just sit online and I’m privileged enough to work at an institution that sees this also.

Split Second: Indian Paintings is now on view through January 1, 2012, on the second floor of the Brooklyn Museum
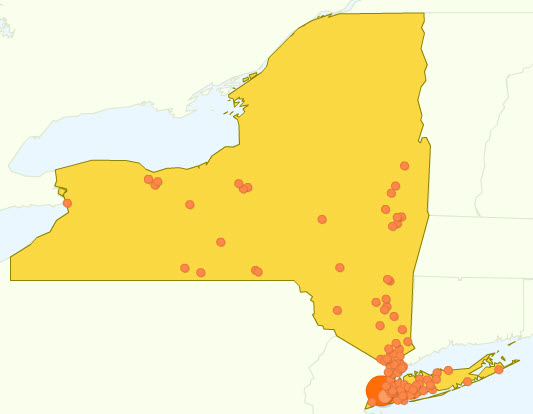
Whenever we start a project that is digitally born, we wonder if will find a local audience. In Split Second‘s case participants came from 59 countries with most traffic coming from the United States, but there was an overwhelming majority of participants coming from NYC and they were the most dedicated of the bunch. On average, a participant spent 7 minutes and 33 seconds in the online activity, but if you were from NYC the average was 15 minutes. I’ll never forget seeing this map in Google Analytics, which so clearly visualizes what happened online—a local audience found us and they took this project very, very seriously.

Map in Google Analytics showing participants from NYC area.
Even knowing that we reached a local audience, the challenge with this show would be to create an installation that would make sense to every visitor coming in the door, whether they participated with us online. Only time will tell if we effectively accomplished this, but I feel lucky to work with a talented team of editors, designers and interpretative materials staff who could take this material and help shape it while keeping every visitor’s perspective in mind.
At the end of the 10-week online activity 4,617 participants created 176,394 ratings and this resulted in an incredibly rich data set to explore. In the gallery, we followed Joan Cummins’ mantra…”But, what’s the so what?” and we took the most conclusive findings—the things we thought would have the most impact—and installed the works that illustrated those points. On the web, you can review the results by exploring a visualization comparing works, data stories and a profile of each painting using the data gathered. Saying there was a lot of nuanced data to explore is putting it lightly and in the coming weeks Beau Sievers is going to be blogging about the incredibly complex findings.
In Blink: The Power of Thinking Without Thinking, Gladwell isn’t endorsing or disputing the quick decisions we make on the spur of the moment—he just explores the notion of them through a lot of different avenues. Our data very much supports his theories; rapid cognition does have an effect on what we see and how we process the art before us, but it shifts and changes under various conditions.
If you took part with us online, I can’t thank you enough for your contribution. We hope you can come see the installation, explore the website and stay tuned for Beau’s analysis of the data.

Shelley Bernstein is the former Vice Director of Digital Engagement & Technology at the Brooklyn Museum where she spearheaded digital projects with public participation at their center. In the most recent example—ASK Brooklyn Museum—visitors ask questions using their mobile devices and experts answer in real time. She organized three award-winning projects—Click! A Crowd-Curated Exhibition, Split Second: Indian Paintings, GO: a community-curated open studio project—which enabled the public to participate in the exhibition process.
Shelley was named one of the 40 Under 40 in Crain's New York Business and her work on the Museum's digital strategy has been featured in the New York Times.
In 2016, Shelley joined the staff at the Barnes Foundation as the Deputy Director of Digital Initiatives and Chief Experience Officer.
