Tiny Cards, Big Fun: What Impact?
In 2017 we partnered with educational start-up Duolingo and their new digital platform, Tinycards, to produce fun and educational art history flashcard decks. 2 years, 24 decks, 1,000 followers, and 9,339 pins later, our partnership has officially come to a close. Here’s the wrap up.

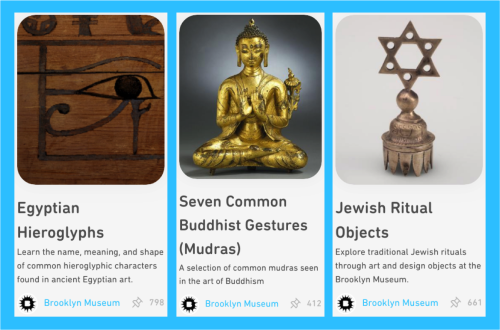
Our collection of decks span a variety of subjects. While some, like “Jewish Ritual Objects” are object focused, others capitalize on small details, like hieroglyphs or hand gestures, to broaden the thematic scope.
Our original goal in partnering with Tiny Cards was to reach new audiences. Not solely by publishing photos and fun facts to their platform, but by framing our collection in new and engaging ways. Our themed decks explored Egyptian hieroglyphs, Buddhist mudras, and Jewish ritual objects, to name a few.
These decks proved a stimulating challenge to formulate, requiring both creative thinking and rigorous research. They were also surprisingly time consuming to produce, requiring collaboration with our curatorial, editorial, and design departments, which often created unforeseen delays. From start to finish, producing a deck took about 5 weeks. In the beginning, we were publishing biweekly, but that quickly became unsustainable and we scaled back to once per month. Even then, we kept returning to the same question: what is the return on this significant investment of staff time and energy?
As time went on, it became less about whether Tiny Cards was fun (it was!) and more about whether Tiny Cards was useful (hard to say). Were we reaching this sought after “new audience”? Were we meeting their wants and needs? What made a deck popular? How could we apply that knowledge to create more successful decks in the future? And so on.
Metrics are limited, which make many of these questions unanswerable, but here’s what we do know. We have access to the number of people who follow our account (1,000) and the number of people who have “pinned” a deck, essentially bookmarking or favoriting it for future reference. 9,339 pins across 24 decks is not insignificant. These pins serve as a measure of relative popularity and success within our 24 deck set.

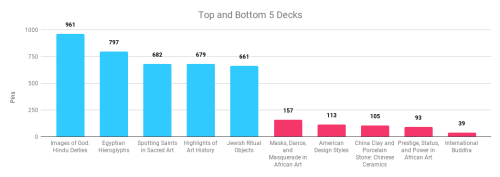
Here are the top and bottom 5 Tiny Cards decks, according to pins. The “success” of our decks varied wildly with some garnering as many as 961 pins and others only 39.
What’s interesting is that publish date doesn’t seem to have an impact on accumulated pins. Rather it’s the content of the decks, likely as conveyed by the title and cover image, that draw people in. For example, our 3rd published deck, titled Images of God: Hindu Deities, is our most popular with 961 pins. It’s followed by our 12th published deck, Egyptian Hieroglyphs, with 795 pins. In fact our top 5 decks, published 3rd, 12th, 4th, 23rd, and 19th respectively, account for 40% of our total pins.
Without more granular data, it’s hard to say exactly why these decks performed so much better than the others. Three-fifths of the Top Five deal with religion, so maybe that’s a draw, but then how do you explain our worst performing deck International Buddha, which has only 39 pins? Egypt is generally popular, right? But the other Egyptian decks rank 7th, 9th,12th, 13th, and 16th in terms of pins. Highlights of Art History (679 pins) being a draw for students might account for its popularity, but our other “art history 101” deck on the Ashcan School has less than half the pins (300). The truth is there’s just nowhere further to go until and if more data becomes available, which seems unlikely.

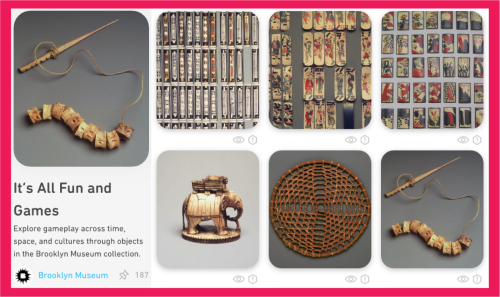
Tiny Cards has prompted the formulation of new frameworks for interpreting our collection that can be exploited elsewhere. For instance, the research conducted for this deck on games could inform in-gallery engagement activities.
Let’s broaden the scope of our lessons learned beyond the data for a moment. This project served as an outlet for creative energy that will no doubt spark inspiration for future activities. I’ve already been thinking of ways to incorporate gameplay into our galleries after researching the various game boards, playing cards, and die in our collection for the It’s All Fun and Games deck. This wrap up also highlights the importance of establishing goals, measures for success, and evaluation strategies before or shortly after we rollout public facing activities. Otherwise, how can we continue to make data driven decisions to serve our audiences, both existing and untapped?
While the decks we have already created will remain on the platform for audiences to enjoy, it’s time for us to redirect our energies into projects with more measurable impact. Goodbye Tiny Cards; it has indeed been Big Fun.

Rachel Lewis joined the Brooklyn Museum in 2017 as a member of the ASK team and is currently the Assistant Manager of Visitor Engagement. Working with the curatorial, design, editorial, and education departments, she crafts diverse and engaging experiences for audiences across platforms, with the goal of fostering deeper connections with our collections and exhibitions. She is especially interested in exploring the possible applications of emerging technologies in museums. She has previous experience in research, programming, and content strategy from the Mexico Field Office of the United Nations Educational, Scientific and Cultural Organization (UNESCO) and the American Museum of Natural History’s Department of African Ethnology. When not at work, you can find her dancing in a studio, on the sidewalk, on the subway, basically anywhere with enough space for a decent pirouette.
Rachel Lewis
Rachel Lewis joined the Brooklyn Museum in 2017 as a member of the ASK team and is currently the Assistant Manager of Visitor Engagement. Working with the curatorial, design, editorial, and education departments, she crafts diverse and engaging experiences for audiences across platforms, with the goal of fostering deeper connections with our collections and exhibitions. She is especially interested in exploring the possible applications of emerging technologies in museums. She has previous experience in research, programming, and content strategy from the Mexico Field Office of the United Nations Educational, Scientific and Cultural Organization (UNESCO) and the American Museum of Natural History’s Department of African Ethnology. When not at work, you can find her dancing in a studio, on the sidewalk, on the subway, basically anywhere with enough space for a decent pirouette.


Start the conversation